Softball Spray Charts That Capture Themselves
The free softball spray chart app for youth coaches
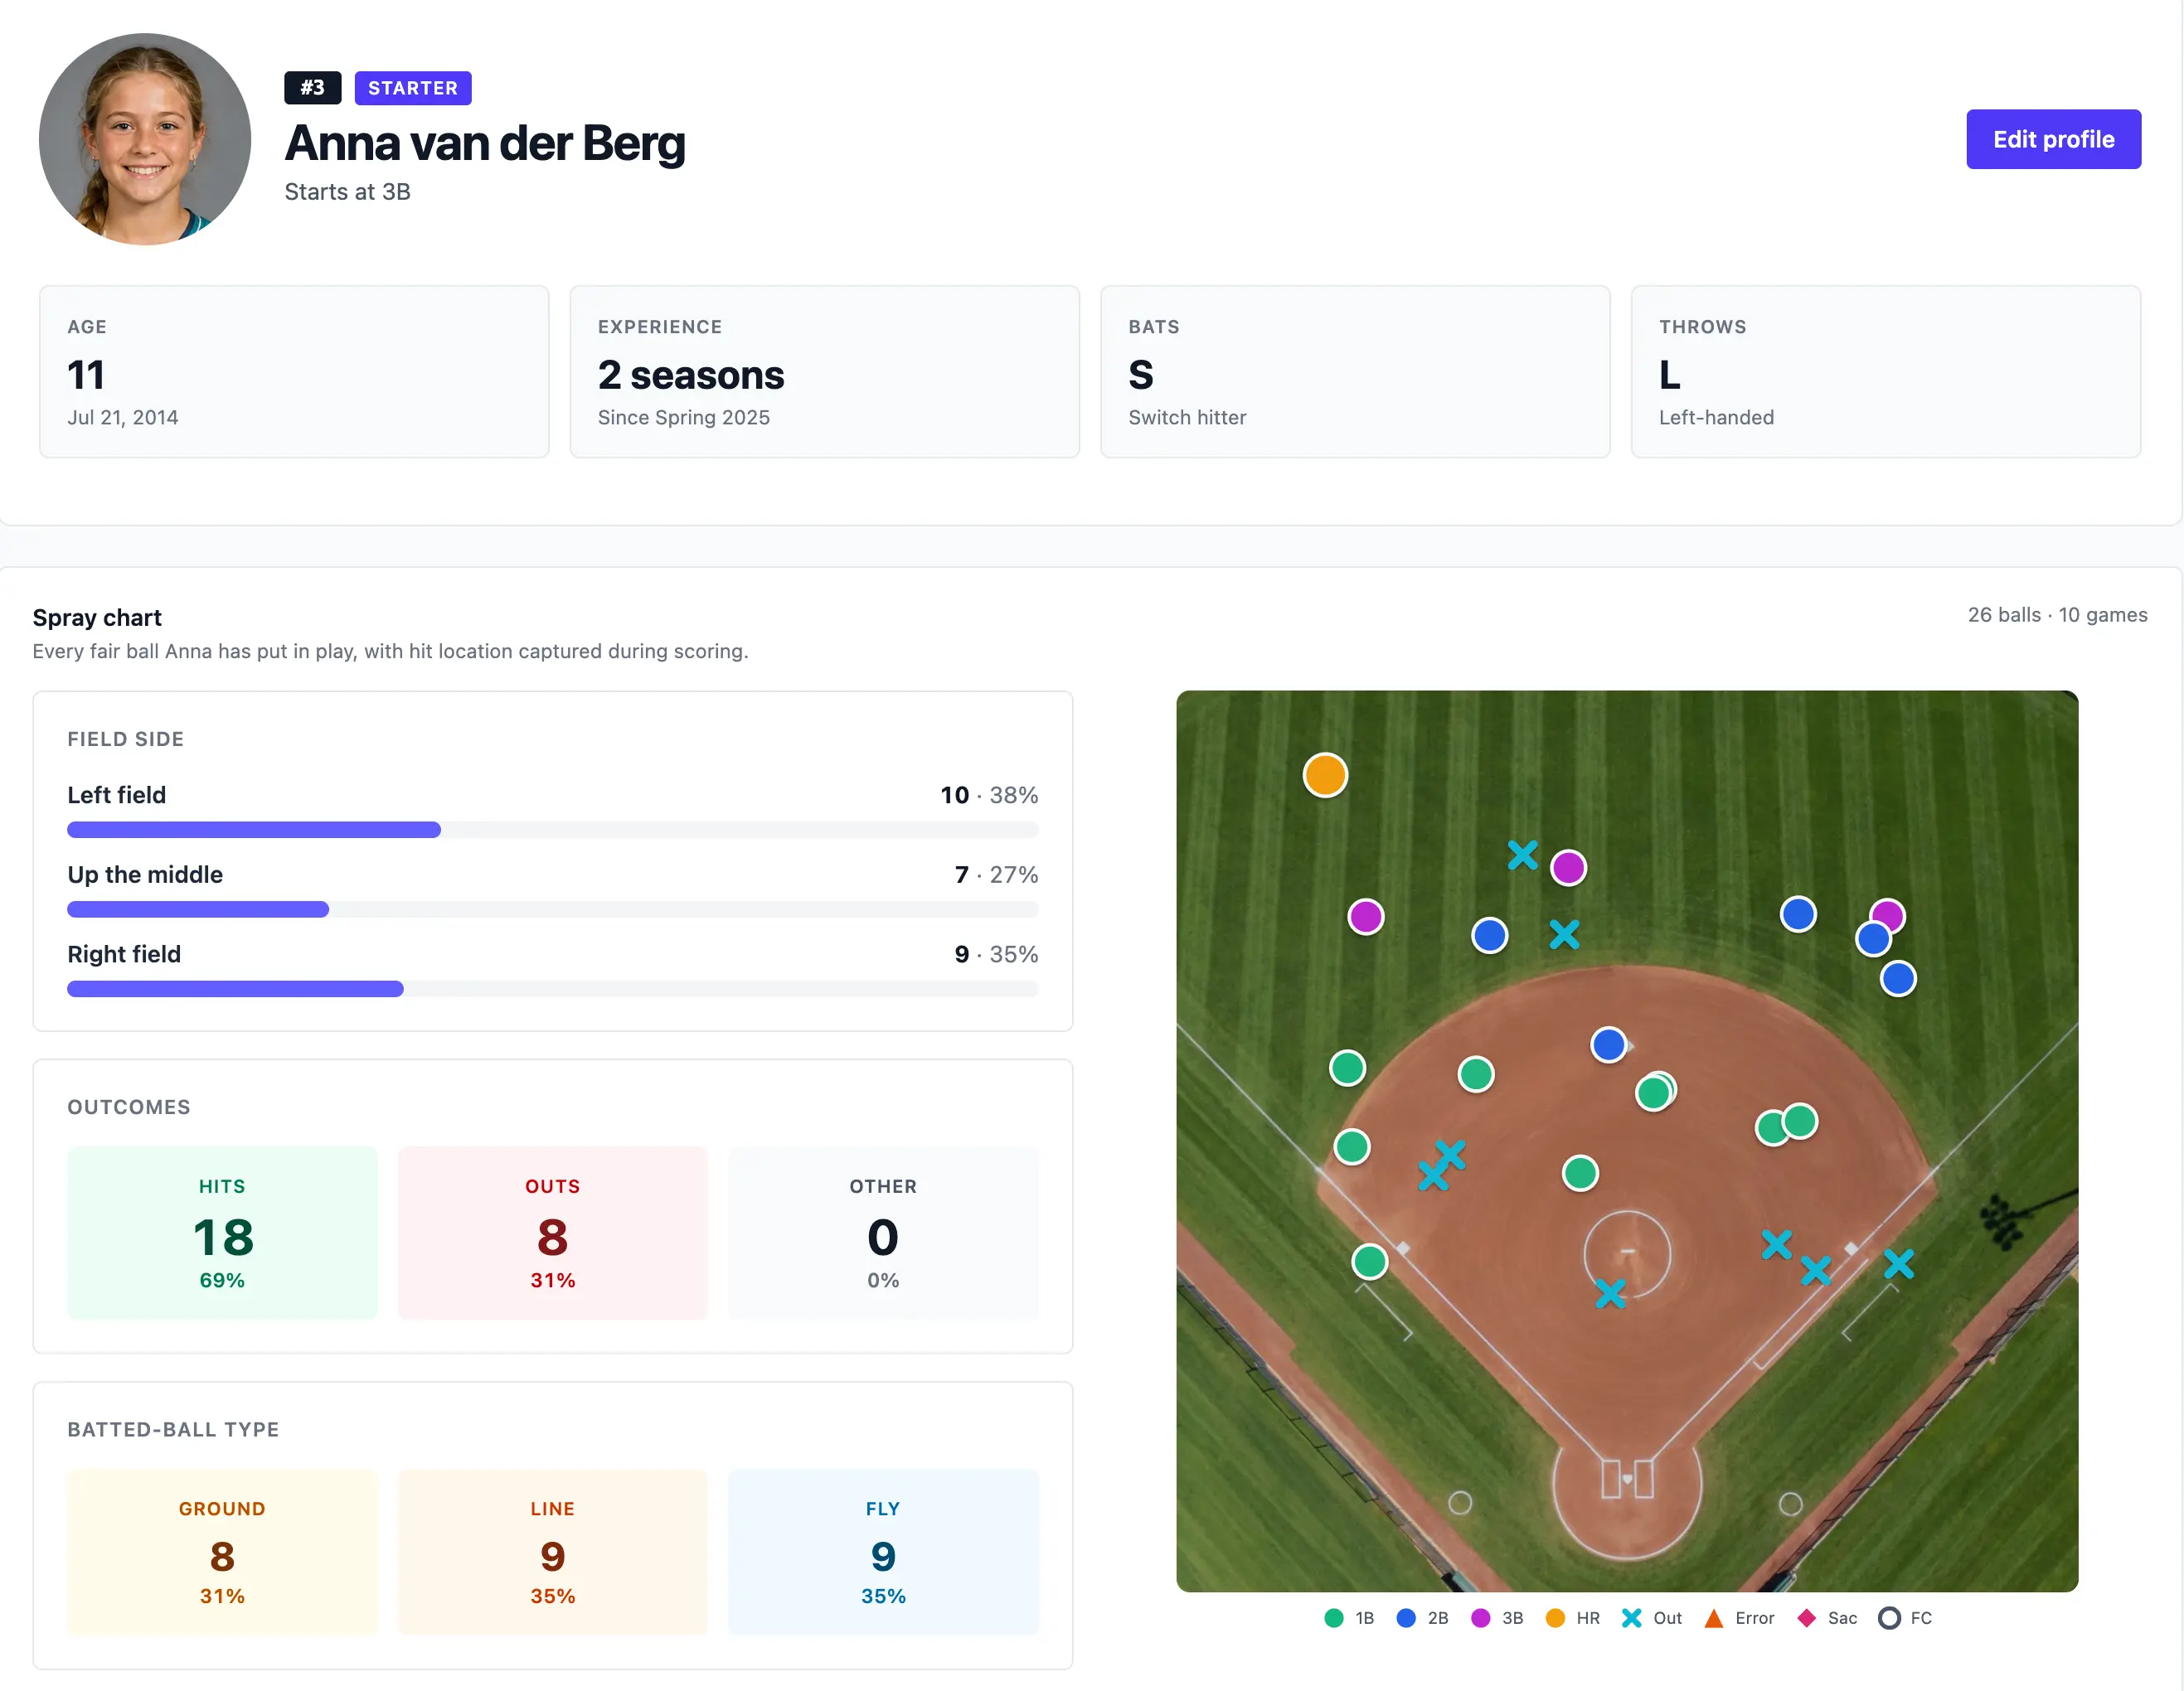
Score the game like you always do. Tap the field where the ball landed. Lineupp builds a live spray chart for every batter — your hitters and the opposing lineup. Pull up an opposing batter on the dugout tablet to position your defense, review your own players' tendencies across the season between games, and let your players see their own charts to coach themselves.
Completely free. No credit card. Captured during scoring, with no separate charting app.
Stat sheets aren't enough
Numbers tell you what. Spray charts show you where.
Five places where a paper scorebook quietly costs you runs — and how the same data, plotted on a field, fixes every one of them.
What you capture
Numbers in a column: 2-for-3 with a double. A great box score line that tells you nothing about *where* she's hitting the ball or who fielded it.
Every fair ball plotted on the field — pull side or oppo, infield or warning track, ground ball or line drive. The result *and* the picture, captured during the at-bat.
Defensive positioning
You have to guess. Was that double down the left-field line a pull tendency or a flare she'll never hit again? The stat line doesn't say.
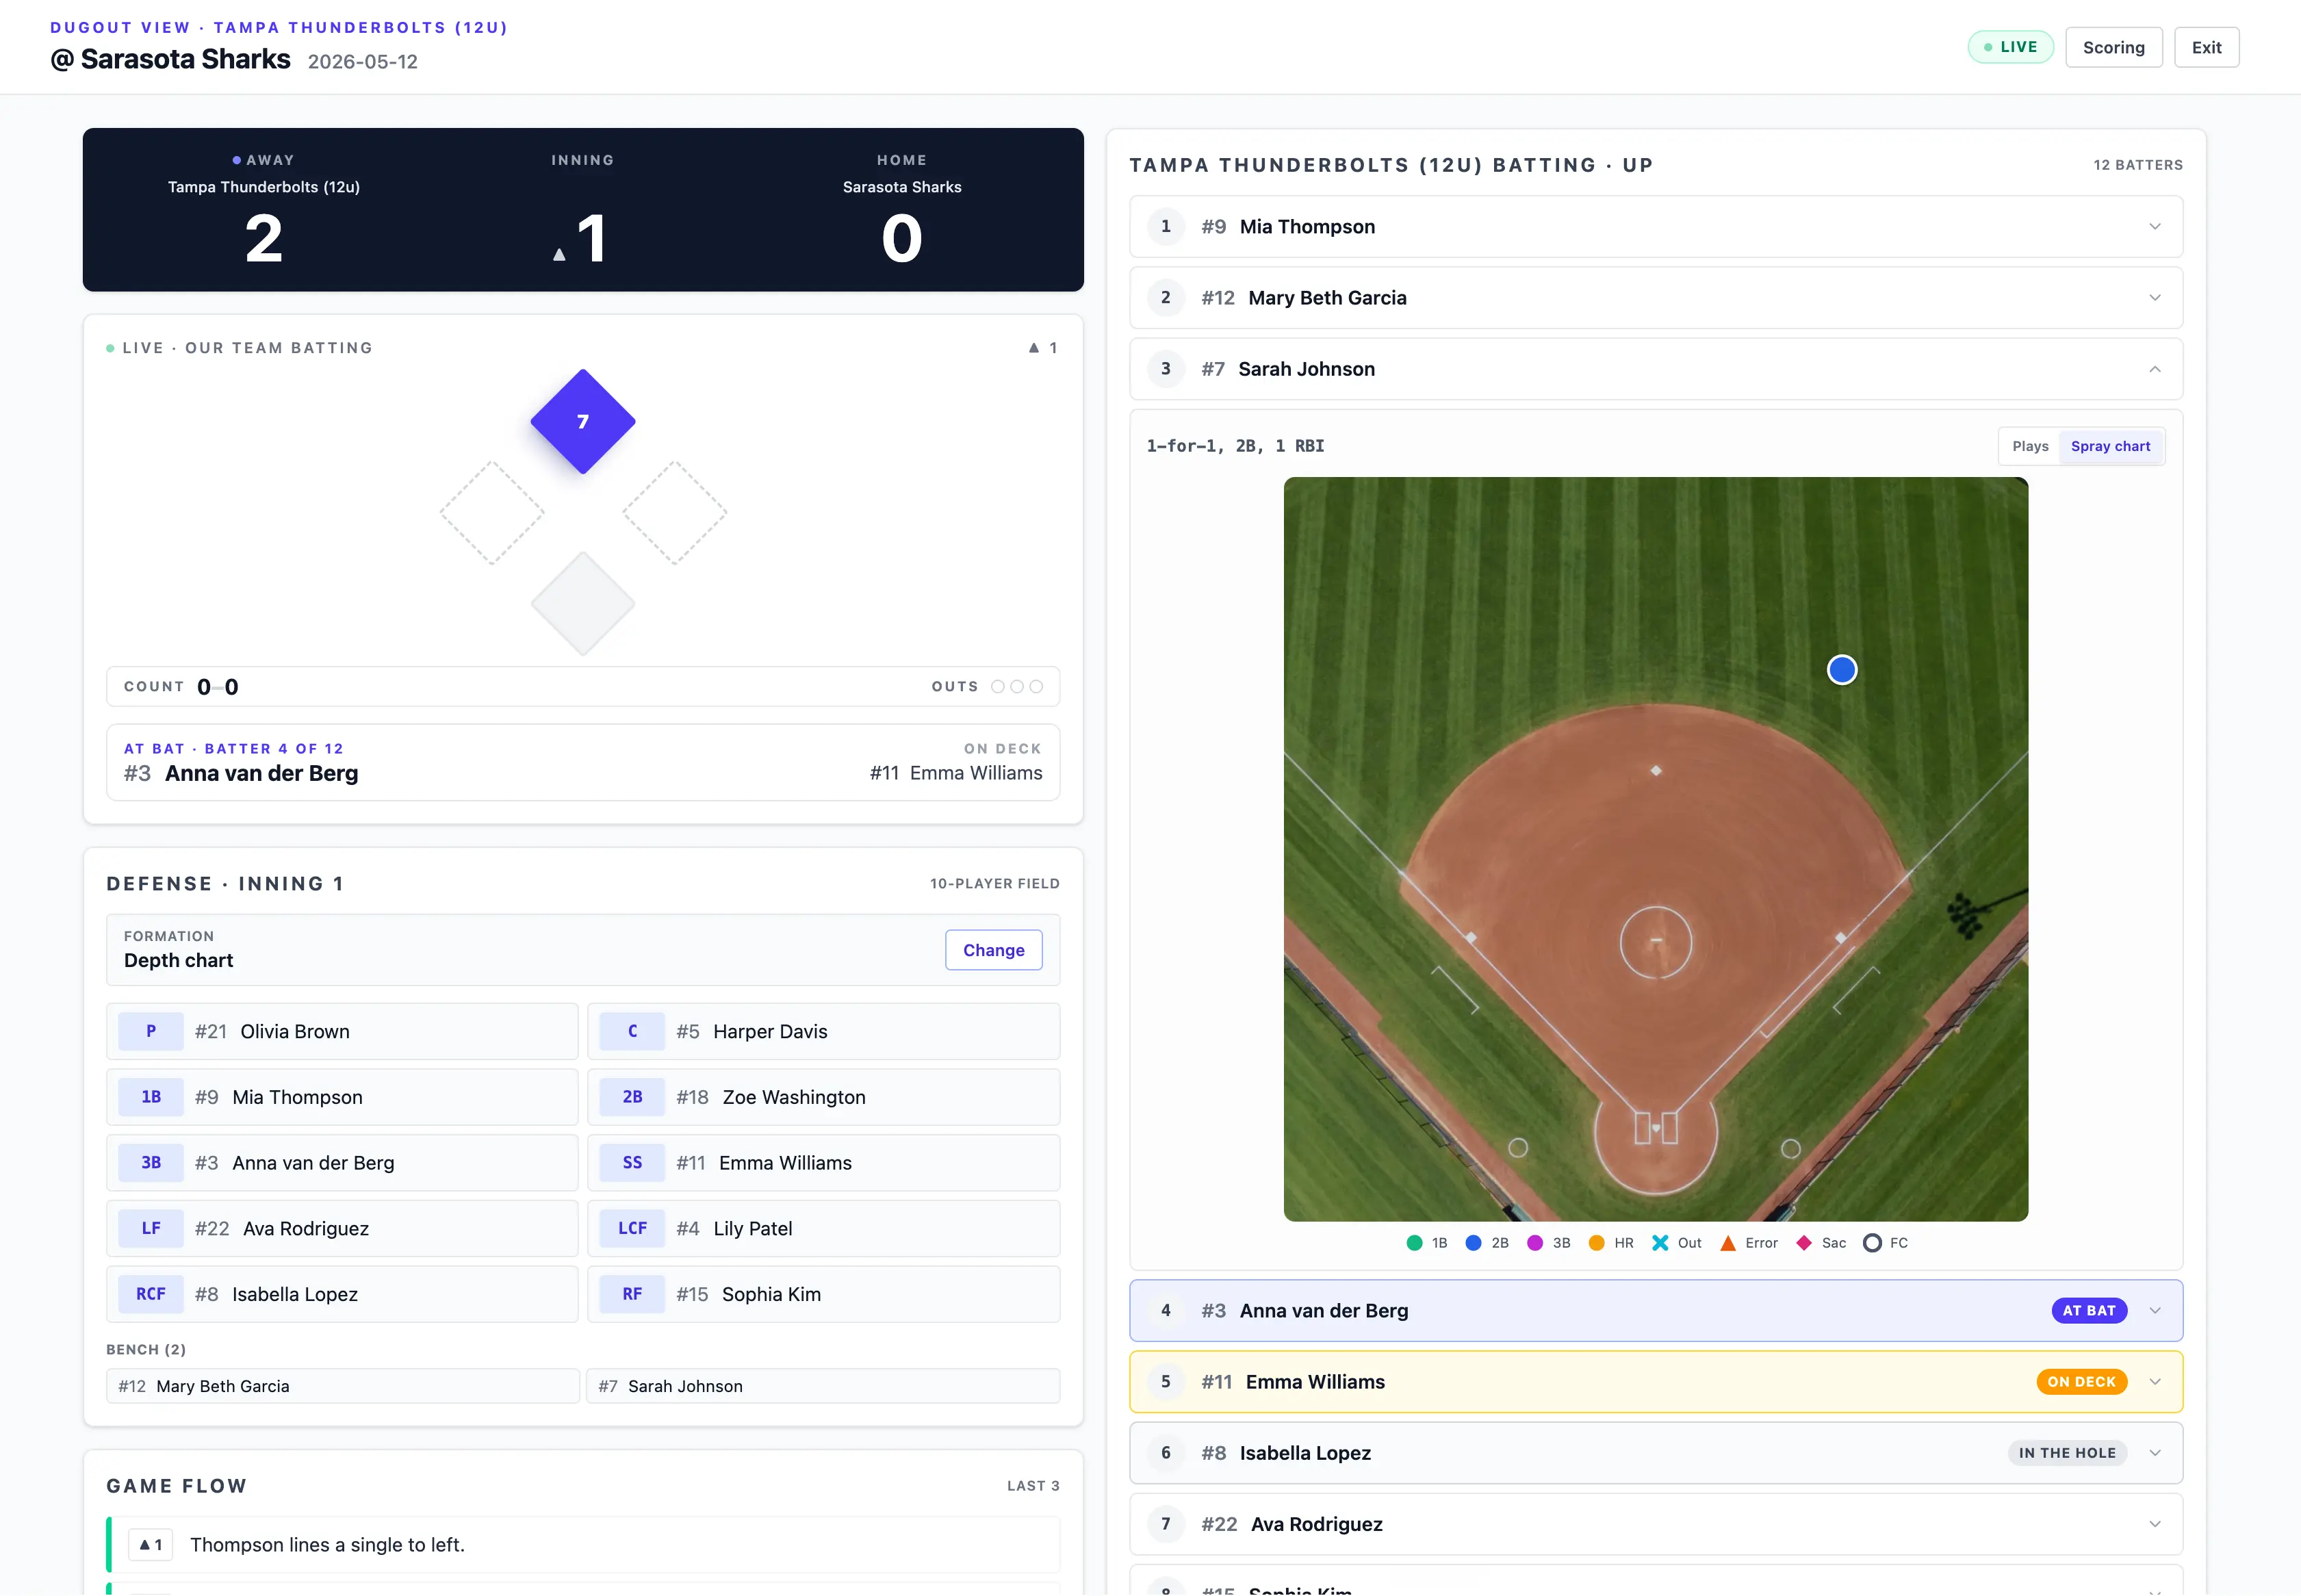
Open her chart on the dugout tablet between innings and shift the SS toward the 5-6 hole because two of her three hits this game have landed there. Position your defense off real evidence, not vibes.
Hitter feedback
“You went 1-for-4.” Your hitter shrugs. Stat sheets quantify the slump but they don't help your hitter see what's causing it.
“Look — every ground ball this month has gone to short. You're pulling everything because you're rolling over.” The dots make the diagnosis obvious.
During the game
A scorer fills out at-bat results in a paper book or a spreadsheet. Spray data isn't captured because there's no field to tap on — just rows and columns.
During scoring, the scorer taps the spot on the aerial field where the ball landed. One tap, two seconds, and the chart is built for the entire game in real time.
Cost
Free — but you only get half the story. The advanced hitting data (heat maps, spray angles, pull rate) costs $9 to $20 a month per team on GameChanger Plus, ChartIT, or Hudl.
Free with Lineupp. Tap-to-capture, per-batter drilldown, per-game grid, and the season rollup are all included — no per-team upcharge, no premium tier.
How it works
How to make a softball spray chart in Lineupp
Three steps. No separate charting app. Built into the same scoring flow you already use during the game.
- 1
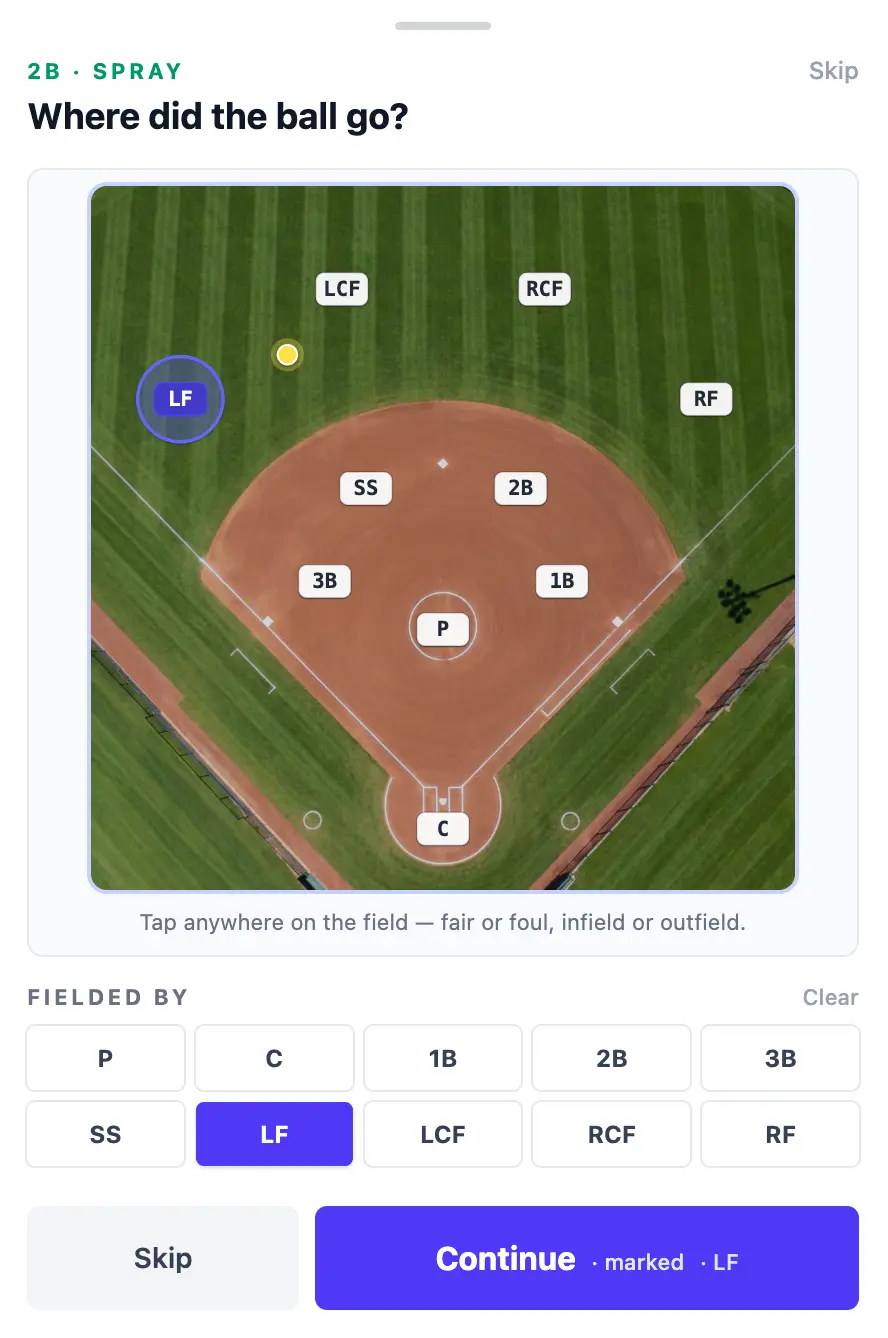
Tap the field
While you're scoring an at-bat, tap the spot on the aerial field where the ball landed. Pick the result (1B, 2B, GO, FO…) and the fielder — one tap, two seconds, the chart point is captured.
- 2
Strategize from the dugout
Between innings, pull up the opposing hitter on the dugout tablet and her chart for this game loads instantly — every fair ball she has already put in play. Shift the SS toward the hole, walk the corners in on a bunter, call pitches around what you're seeing in real time.
- 3
Review your own players
Between games, open any hitter's profile and the season aggregate — plus a per-game grid that shows tendencies evolving week over week — is right there. Spot the slumping hitter who's rolling everything over to short, plan Tuesday's practice off real evidence, and let each player pull up her own chart from her player profile.
Inside the spray chart system
Everything you need to chart hits — and put the data to work
Lineupp captures the spray data during the at-bat and surfaces it everywhere you'd already be looking — player profile, dugout view, per-game grid — without forcing you into a separate analytics app.
-
Tap-to-capture during scoring
The scoring screen shows an aerial softball field. Tap where the ball landed — that's the chart. Capture spray data in the same two seconds you'd already be entering the at-bat result.
-
Season rollup & per-game grid
Player profile shows the season-long aggregate plus a per-game grid of mini charts — so you can watch a hitter's tendency evolve week over week, not just stare at one frozen view.
-
Pull / center / oppo breakdown
Field-side bars below the chart break every fair ball into pull, up-the-middle, and opposite-field. Spot a 70%-pull tendency at a glance and position the defense to take half the field away.
-
Trajectory + fielder captured
Each dot also records ground ball vs. line drive vs. fly ball and who fielded it. That's the data you need to coach defense, not just hitting — and to spot which position is leaking runs.
-
Dugout per-batter drilldown
In dugout mode, pull up the opposing hitter at the plate and her chart loads on the tablet — make positioning calls in real time instead of guessing from a paper scout report.
-
Players see their own charts
Every player has her own profile in Lineupp. She opens it up and sees the same spray chart her coach is looking at — visual feedback that's hard to argue with and easy to internalize.
Three ways spray charts work in Lineupp
One capture. Three different jobs.
Every tap on the field during scoring feeds three different surfaces: live opponent strategy on the dugout tablet, season-long review for your own hitters, and a personal chart each player can pull up on her own profile.
For coaches · in-game
Scout opposing batters
On the dugout tablet, tap any opposing hitter and her chart for this game pops up — every fair ball she has put in play, updated as the game unfolds. Position your defense and call pitches against real tendencies the second they emerge.
- Tablet-first dugout view, glance-readable between pitches
- Updates live as new at-bats get scored
- Pull / center / oppo splits highlight defensive shifts
For coaches · between games
Track your own hitters
Each of your players gets a season-long chart with a per-game grid underneath. Review the week's games, spot the hitter who started rolling everything over to short, and walk her through the visual before Tuesday practice — diagnosis and feedback in one screen.
- Season aggregate + per-game grid for every player
- Lineup decisions backed by real spray tendencies
- Pull up the chart during practice for visual feedback
For players · on their profile
Players see their own charts
Each player can open her own profile in Lineupp and pull up her spray chart — every fair ball, every game. She sees the same picture her coach is seeing, takes ownership of her tendencies, and shows up to practice with a real question to work on.
- Self-service player view — no coach hand-off needed
- Visual feedback athletes actually internalize
- Practice intent driven by what the dots are saying
By age group
Spray charts at every age level
What you do with the chart changes as your players develop. The capture flow is the same at every level — what changes is how you use the picture.
Beginner
10U · 12U
Use the chart for hitter feedback. "Every ball this month went to third — you're swinging late." Players see the picture and internalize it in a way no stat line can.
Intermediate
12U · 14U · 16U
Start coaching defense off the chart. Pull-side shifts on the 70% pull hitter, corners in on the bunter, outfielders deep on a ball that's flying. Real evidence, real positioning.
Advanced
HS · Travel
Scout opposing hitters live during the game, plan pitch sequencing off their in-game tendencies, and build your own lineup decisions around field-side splits across the season. Spray charts are how the top youth programs already coach.
Why Lineupp
The free softball spray chart app that's part of your whole season
Most spray chart tools are paid analytics products bolted onto a separate scoring app. Lineupp's chart is built into the same scoring flow you already use — so your hit data lives with your roster, lineup, schedule, and chat instead of behind a premium paywall.
Lineupp
- Completely free. No premium tier or per-team upcharge. Capture as many at-bats as you want, every game, every season.
- Captured during scoring. No separate data-entry pass after the game — chart and scorebook are the same workflow.
- Part of the whole app. Roster, lineup, depth chart, schedule, parent chat, live scoring, wristbands, and spray charts in one place.
- Built for fastpitch. Aerial field diagram, position vocabulary, and trajectory options tuned to softball — not a generic baseball tool with the labels swapped.
Other spray chart tools
- Spray charts gated behind a premium subscription ($9–$20+ per month per team).
- Hit-location data is a post-game entry step on a paper sheet — not captured live during scoring.
- Disconnected from the rest of your coaching workflow — you maintain a separate analytics app for the chart.
- Built for college / pro baseball — defaults and vocabulary don't quite fit youth fastpitch.
- Or it's a free PDF you fill out by hand — useful, but you don't get the season aggregate or pull-tendency math.
Questions, answered
Softball spray chart FAQ
A spray chart is a diagram of a softball field with a dot plotted at every spot where a hitter has put the ball in play. The color of the dot encodes the result (single, double, triple, home run, ground out, fly out) and the cluster of dots reveals the hitter's tendencies — pull side, oppo, up the middle, ground ball, fly ball. Coaches use the chart to position the defense, plan pitch sequencing, and give hitters concrete feedback about where they're driving the ball.
With Lineupp, the chart builds itself during the game. While you're scoring an at-bat, tap the spot on the aerial field where the ball landed and pick the result (1B, 2B, 3B, HR, GO, FO, LO, K, or E). That's it. The point lands on the chart for that batter, for that game, and for the season. There's no separate data-entry step — spray data is captured the same way every other at-bat detail is.
Yes. It's completely free, with no credit card and no per-team upcharge. Spray charts on competing apps live behind a premium tier (GameChanger Plus is $9.99/mo, ChartIT and Hudl run higher) because they treat advanced hitting analytics as a separate product. We bundle them into the standard scoring flow because once you've already captured the at-bat result, capturing *where* the ball went is one extra tap.
Coaches start using spray charts seriously around 12U — the age where hitters can intentionally drive the ball to a part of the field and the value of pull-side defensive shifts kicks in. 10U and below benefit from the visual feedback (“see how every ball went to right? you're swinging late”) even if the strategic positioning matters less. High school and travel-ball teams use spray charts for opponent scouting and lineup decisions: who to slot at the top of the order vs. who's a pull-side hole hitter.
Lineupp puts spray charts inside the same app that runs your roster, lineup, depth chart, schedule, parent chat, and live scoring — so the chart is part of one season, not a bolt-on. GameChanger has spray charts only on the paid “Team Manager Plus” tier and locks the deeper analytics behind subscriptions to their stats platform. ChartIT specializes in advanced hitter charts but starts at roughly $9.99 per month per coach and assumes you're running a separate full-charting workflow. Lineupp's chart is simpler, free, and lives in the same place as the rest of your season.
Both. The player profile shows the season-long rollup with every fair ball plotted on one field, plus a per-game grid that breaks the season into one mini-chart per game so you can see trends evolve. The dugout view shows the per-batter chart during the game itself, so you can pull up a hitter's chart between innings and make positioning calls in real time.
Yes. A Lineupp player account opens to her own profile, which shows the same spray chart her coach is looking at — season aggregate plus per-game grid. Older players use it to take ownership of their hitting tendencies (“I'm pulling everything to short… I need to stay back”) and show up to practice with a specific thing to work on. It's one of the few places youth athletes get real, visual self-evaluation data the way college and pro hitters do.
Yes. When you tap a spot on the field, the chart also records who fielded the ball (the position badge that lit up under your tap) and the trajectory (ground ball, line drive, fly ball, or pop up). That richer data is what makes the chart useful for *defensive* coaching, not just hitter coaching — you can spot that your 3B is letting balls through to LF, or that your CF is misreading line drives off lefties.
Lineupp also ships a free printable spray chart PDF — 12 player tracking blocks across two Letter pages, with field diagrams to plot hits with a pen during games where you don't want a phone in your hand. Find it on the free resources page along with our printable pitch chart and game-planner.
What is a softball spray chart?
How do you make a softball spray chart?
Is Lineupp's spray chart really free?
What ages should use spray charts?
How is this different from GameChanger or ChartIT?
Can I see spray charts per game and per season?
Can players see their own spray charts?
Does the spray chart capture fielder and trajectory too?
Can I print or export the spray chart?

Free for every team
Try Lineupp. It's completely free.
No credit card, no commitment. Lineupp is free for every team, with no paywall or feature gating. Tell us a bit about your team and we'll get you set up before your next practice.
Lineupp
Everything included.
Free for every team. Everything below is included.
What's included
- Unlimited players, parents, and assistant coaches
- Roster, schedule, and practice plans
- Depth chart and defensive formations
- Lineup builder with printable cards
- Live scoring with public scoreboard link
- Dugout monitor for the fence-clip tablet
- Playbook and printable wristband play-call cards
- Team chat with parent and coach permissions
- Film review with YouTube, Vimeo, and direct uploads
- Game-day checklist and snack rotation
- Full CSV export — your data is always yours